
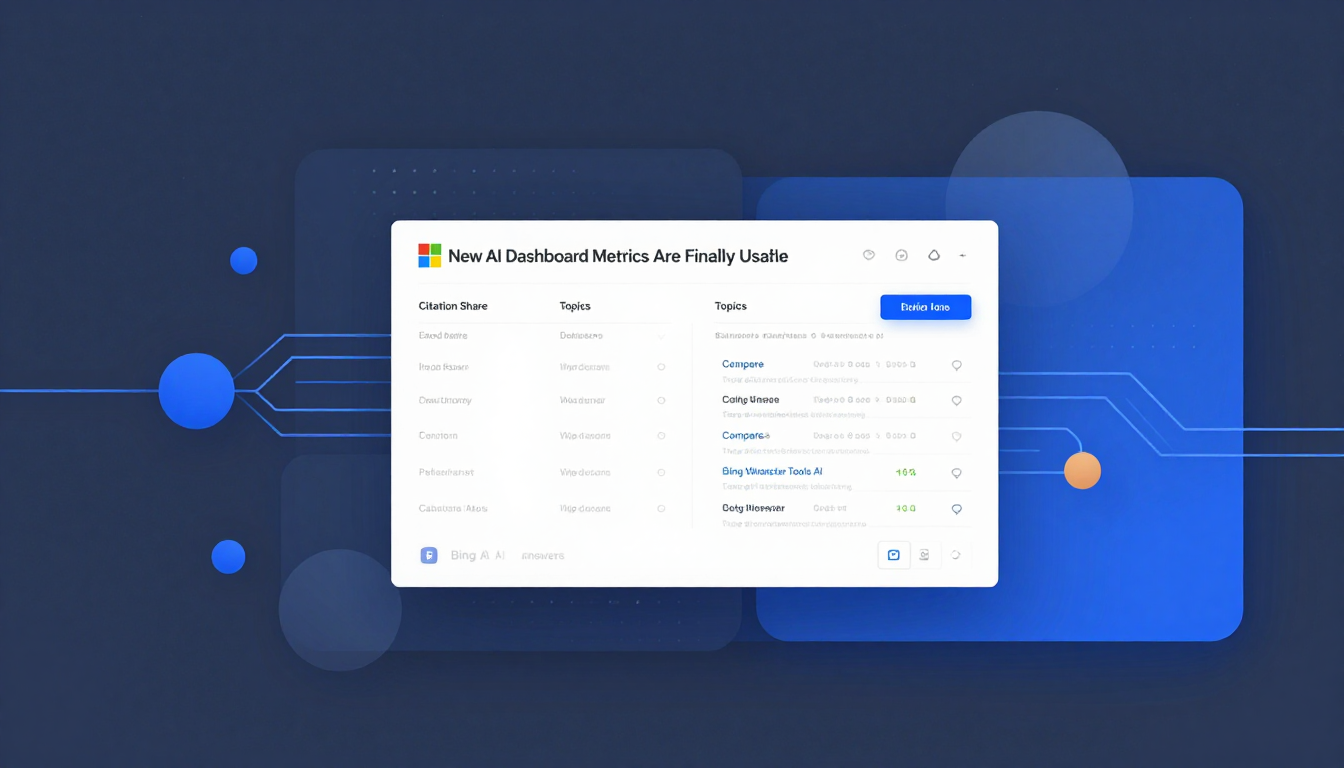
Your Citation Share Just Got a Lot Clearer
If you've been staring at the Bing Webmaster Tools AI Performance dashboard wondering whether your site is actually winning in Copilot answers, Microsoft just made that question a lot easier to answer. The new Citation Share metric shows you what percentage of all citations for a given grounding query your site captures. Raw counts told you how many times you were cited. Citation Share tells you how much of the pie you're actually eating.
The rollout went global on June 16, 2026. Three of the four new features — Citation Share, Intents, and Topics — were previewed at SEO Week earlier this year. Compare was also announced alongside them. All four are now live in the AI Performance dashboard preview, and they're genuinely useful improvements over what was available before.
Let's break down what each one does, why it matters for your content strategy, and what Microsoft is still holding back.
Citation Share: The Metric You Actually Wanted
Here's the problem with raw citation counts. If your site got cited 5 times for a query last month, that sounds good until you realize there were only 6 total citations across all sources. You're dominating a niche query with almost no volume. Or the opposite: you got cited 50 times, but there were 5,000 total citations out there. You're a drop in the ocean.
Citation Share solves this by showing your percentage of all citations for a specific grounding query. If your site received 3 out of 10 citations, you see 30%. Simple. Relative. Immediately actionable.
Microsoft is careful to call this an observational metric. It doesn't expose which competitor domains are getting cited alongside you, and it doesn't represent traffic share. You won't see "Competitor X got 40% of citations for this query." That's a deliberate design choice, and honestly, it makes sense. Publishers would weaponize this data in ways that probably wouldn't serve the ecosystem well.
The metric is still useful on its own. Knowing you're capturing 30% of citations for a query tells you something about your relative authority in that topic. You can track whether that share is growing or shrinking over time, especially with the new Compare feature.
Intents: Grouping Queries by What People Actually Want
Grounding queries in the AI Performance dashboard have always varied wildly in phrasing. One query might be "best CRM software for small business," another could be "what's the best CRM for startups on a budget." They're essentially the same intent, but they look like completely different data points in a raw list.
Intents fixes this by classifying grounding queries into categories. The current classification set includes Informational, Commercial, Research, Learn & Solve, Navigational, Creation, and Local. Instead of manually sorting through hundreds of individual queries to figure out what they have in common, you get automatic grouping.
This matters because it reveals patterns you'd otherwise miss. Is your AI visibility concentrated in informational queries? That tells you your content is being used as a reference source. Commercial intent citations suggest your product pages or comparisons are feeding into AI answers. Research queries might mean your long-form analysis is being pulled as a primary source.
Microsoft notes that Intents classifications are still maturing. The quality will improve as more data flows through the system, so don't read too much into edge cases right now. But the framework itself is solid.
Topics: Seeing the Forest Instead of the Trees
If Intents groups queries by what people want, Topics groups them by what they're asking about. Queries like "solar panels," "solar energy efficiency," and "residential solar installation" roll up under a broader topic label. You stop seeing individual keyword fragments and start seeing thematic clusters.
This is the kind of feature that makes the dashboard actually usable at scale. Before Topics, you were looking at a flat list of grounding queries and trying to mentally group them yourself. That works fine for a handful of queries. It falls apart when you have hundreds.
Topics gives you a higher-level view of where your AI citations are concentrated. Are you strong in one topic area and weak in another? Does your content strategy align with where the citations are actually flowing, or are you publishing in areas that AI systems aren't pulling from?
Like Intents, Topics classifications are still improving. Microsoft hasn't promised a specific timeline for when they'll reach parity with what publishers really need, but the direction is right.
Compare: Tracking Your Citation Trajectory
The Compare feature lets you overlay a previous time period on the current view. You can compare the current 30 days against the prior 30 days, or pick custom date ranges if you need something more specific.
This seems straightforward until you realize how hard it was to track citation trends before. Raw counts in a static dashboard don't tell you whether your visibility is growing, shrinking, or staying flat. You needed to export data, build charts, and do the comparison yourself.
Now it's built in. You can see whether your Citation Share improved after publishing a new piece of content, whether it dropped after an algorithm change, or whether seasonal patterns are affecting your AI visibility. It's the difference between having a snapshot and having a movie.
The feature is simple, but it's also one of the most practically useful additions. Trend data is what turns a dashboard from a curiosity into an operational tool.
What's Missing: GEO-Focused Recommendations
One feature previewed at SEO Week didn't make it into this rollout: GEO-focused recommendations. These would have surfaced guidance on crawlability, structured data, and indexing — essentially telling publishers what to fix to improve their AI visibility.
Microsoft hasn't provided a timeline for when these recommendations might arrive. That's a notable gap, because the other three features are diagnostic — they tell you what's happening. Recommendations would be prescriptive, telling you what to do about it.
For publishers who want a complete feedback loop, this is the missing piece. Right now you can see your Citation Share, understand your query intents and topics, and track trends over time. But you still have to figure out on your own what changes might improve those numbers.
That's not a dealbreaker. The diagnostic features are genuinely useful on their own. But the recommendations would have made this rollout feel more complete.
Why This Matters for Publishers Right Now
The AI Performance dashboard launched in public preview back in February, showing publishers how often Copilot and Bing AI answers cited their content. Microsoft expanded it in March with a feature that mapped grounding queries to the specific pages cited.
This rollout is the next step. The dashboard has evolved from "here's how many times you were cited" to a proper analytics tool with relative metrics, classification systems, and trend tracking.
For publishers, the practical implication is clear: you now have a real way to measure your visibility in AI-generated answers. You can see whether your content strategy is working in the Copilot ecosystem, identify which topics and query types are driving citations, and track whether your efforts are paying off over time.
It's not Google Search Console. It's not a replacement for traditional SEO analytics. But it's the most detailed public view of AI citation performance that any publisher has had access to, and these new features make it significantly more actionable.
What to Watch Next
A few things are worth keeping an eye on as Microsoft continues to develop this dashboard.
First, the quality of Intents and Topics classifications will improve over time. If you're using these features now, treat the data as directional rather than definitive. The groupings will get sharper as more data flows through.
Second, GEO-focused recommendations may arrive at some point. If Microsoft follows through on that promise, it could close the loop between diagnosis and action in a way that makes this dashboard genuinely essential for publishers.
Third, Google is also testing AI visibility reports in Search Console, though the two products measure different things in different ecosystems. Microsoft's dashboard is focused on citations in Copilot and Bing AI answers. Google's effort will likely focus on AI Overviews in Search. They're parallel tracks, not direct equivalents.
The bottom line: Bing Webmaster Tools just got a lot more useful for publishers trying to understand their role in the AI search ecosystem. The features are live, they're genuinely useful, and they represent a meaningful step forward from where the dashboard started.