
The claim was simple enough to write down: at or above llama.cpp on every axis, for every model we can run. This is the run that tested it across a whole model directory, and the run that refuted it.
The refutation is not a collapse. Prefill at 512 tokens is faster on 8 of 8
files, by +7.71% to +58.33%. Eight-slot serve is faster on 7 of 8, by +4.71% to
+18.64%, with the eighth gated out. Perplexity on a fixed corpus agrees with
llama-perplexity to within 0.23% on every comparable file, and repeated runs
of the same file return the same number to four decimals. Peak VRAM is higher
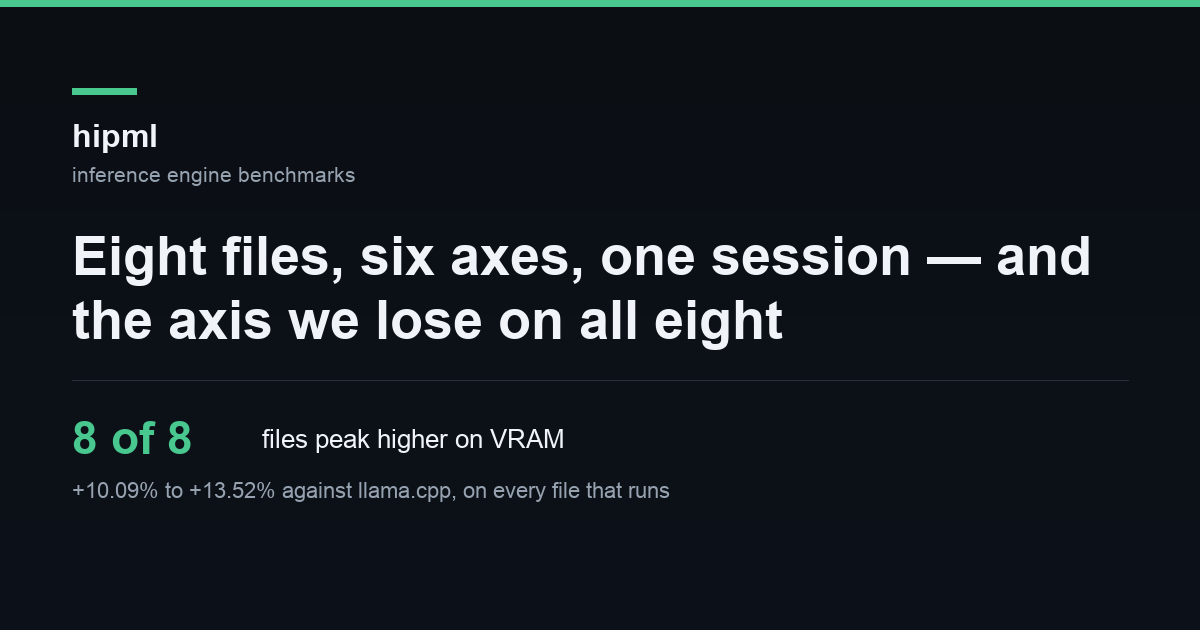
than llama.cpp on 8 of 8 files, by +10.09% to +13.52%. Decode is not a win:
against llama.cpp's faster backend the engine is below on 6 of 8 files at depth
0 and on 8 of 8 at 8,192.
The VRAM column is the verdict. A claim that says "at or above on every axis" fails on the axis where the engine does not win a single cell, and no amount of prefill throughput answers it. The rest of this article is the table that says so, the losses named with their margins, and the one result that most articles would leave out: the gate that decides which rows are allowed to be compared is shallower than it looks.
Correction, 14 November. The first version of this table compared the engine against llama.cpp's ROCm build only, and reported decode as a win on 8 of 8. On this card llama.cpp also has a Vulkan build, and on decode it is 2.07% to 5.05% faster than the ROCm build at both depths, outside every cell's spread. A reader choosing an engine can choose a backend, so the decode and serve columns below are now measured against the faster of the two, and each cell says which one it used. Prefill is unchanged, because there the ROCm build is the faster one by 13.69% to 33.48%; quality and VRAM are unchanged.
Sixteen files, eight of which run
hipml load is not a runnability test. Four of the sixteen .gguf files in the
model directory upload every tensor, report unsupported: none, and then fail
to produce a token. Any attempt table built on load alone overstates the
runnable set by half.
| # | file | GiB | hipml load | hipml generate | verdict |
|---|---|---|---|---|---|
| 1 | Arete-27B-Q4_K_M.gguf | 16.02 | ok | ok | loads+generates |
| 2 | Flint-GGUF-Serve-mixed-4-8bit.gguf | 23.29 | fail | fail | load fails |
| 3 | MiniCPM-V-4.7-35B-A3B-GGUF-Serve-mixed-4-8bit.gguf | 20.62 | ok | fail | loads, generate fails |
| 4 | MiniCPM-V-4_7-35B-A3B-Q4_K_M.gguf | 19.71 | ok | fail | loads, generate fails |
| 5 | OrcaCyber-Nano-1.0-AI-Defense-DFlash2-Q8_0.gguf | 1.92 | fail | fail | load fails |
| 6 | OrcaCyber-Nano-1.0-AI-Defense-Mix-15.7G.gguf | 14.62 | ok | ok | loads+generates |
| 7 | Qwen3.6-35B-A3B-MTP-UD-Q4_K_XL.gguf | 21.28 | ok | fail | loads, generate fails |
| 8 | Qwen3.8-27B-Q4_K_M.gguf | 15.66 | ok | ok | loads+generates |
| 9 | Qwen3.8-27B-UD-Q4_K_M.gguf | 15.43 | ok | ok | loads+generates |
| 10 | Qwen3.8-27B-UD-Q4_K_XL.gguf | 16.35 | ok | ok | loads+generates |
| 11 | Qwen3.8-27B-UD-Q6_K.gguf | 20.47 | ok | ok | loads+generates |
| 12 | Qwen3.8-27B-UD-Q6_K_XL.gguf | 23.56 | ok | ok | loads+generates |
| 13 | Sage-A1.5-Q4_K_M.gguf | 20.22 | ok | fail | loads, generate fails |
| 14 | Swift-1.5-Qwen3.8-27B-Q4_K_M.gguf | 16.24 | ok | ok | loads+generates |
| 15 | dspark-MiniCPM-V-4_7-35B-A3B-Q8_0.gguf | 0.40 | fail | fail | load fails |
| 16 | mtp-Qwen3.8-27B-Q4_0.gguf | 1.28 | fail | — | sidecar |
Eight run, four load and cannot generate, three fail to load, one is a sidecar. The exact errors are worth reading, because they name four different gaps, and only one of them is a file that was never meant to run alone:
| file | verdict | exact error |
|---|---|---|
Flint-GGUF-Serve-mixed-4-8bit.gguf | load fails | load failed: config: GGUF metadata key flint.rope.dimension_count is missing |
MiniCPM-V-4.7-35B-A3B-GGUF-Serve-mixed-4-8bit.gguf | generate fails | generate: graph: token_embd.weight: expected Q4_K or Q6_K, found Q8_0 |
MiniCPM-V-4_7-35B-A3B-Q4_K_M.gguf | generate fails | generate: graph: model has no tensor blk.0.ffn_gate.weight |
OrcaCyber-Nano-1.0-AI-Defense-DFlash2-Q8_0.gguf | load fails | load failed: config: GGUF metadata key dflash.rope.dimension_count is missing |
Qwen3.6-35B-A3B-MTP-UD-Q4_K_XL.gguf | generate fails | generate: graph: token_embd.weight: expected Q4_K or Q6_K, found Q8_0 |
Sage-A1.5-Q4_K_M.gguf | generate fails | generate: graph: model has no tensor blk.0.ffn_gate.weight |
dspark-MiniCPM-V-4_7-35B-A3B-Q8_0.gguf | load fails | load failed: config: GGUF metadata key dflash.rope.dimension_count is missing |
mtp-Qwen3.8-27B-Q4_0.gguf | sidecar | load failed: output.weight: Q3_K has no GEMV entry |
Two files carry a Q8_0 embedding table and the graph accepts only Q4_K or Q6_K
there. Two declare an FFN without blk.0.ffn_gate.weight, a fused layout the
graph does not build. Three are missing a RoPE metadata key under a vendor
prefix the config reader does not know. The sidecar is a drafter, not a model:
it has no output tensor in a type the GEMV path takes, and it is never expected
to run alone. None of these is a speed result; they are the boundary of what
"every model we can run" means.
An earlier recon list named eight runnable files. The count was right and the membership was not: one file on that list fails to load, one file that runs was not on it, and the four files that load and cannot generate were on neither list. A count is not a set.
The method, and why the numbers are comparable
One hold, one binary, one card. The GPU lock was acquired at 00:15:46Z and
released at 02:23:00Z, 127 minutes later, with no lost-lock event. Every number
below came from a binary of 3,044,864 bytes, sha256 ef5b66bd…, built from tree
433bfbe, on one Radeon AI PRO R9700 reporting 31.9 GiB. The reference is
llama.cpp's ROCm build, 11820, commit d7725699, byte-identical to the build
the previous session used. There is a second llama.cpp build on the same card —
the Vulkan one, 11836, commit f5027fb21 — and the method below explains why
the baseline is the faster of the two rather than the one the session happened
to run.
The same file, prompt and corpus on both engines. Both engines were given
the same .gguf path literally on the command line, not through an environment
variable. The timed CLI cells generate 33 tokens from the same 169-id fixture.
The quality cells score the same 8,184-token corpus: 28,035 bytes, 15 windows of
512 tokens, 3,825 scored positions. llama-tokenize read the same text and
agreed with the id stream the engine scored, 8,184 tokens on both.
Interleaved, not blocked. Within each file the two CLI processes ran in opposite order — hipml-then-llama in one, llama-then-hipml in the other — and no file was interleaved with another inside a stage. The llama.cpp cells are not a block measured after the engine was finished for the day.
Three reps, a median and a spread. Every CLI cell in the session is three
reps in each of two processes, so six values; every serve cell is six waves. The
backend check that supplies the decode and serve baselines is one process per
cell, one discarded warm-up request and three timed reps, and three waves for
serve. The number quoted is the median of the cell, and the spread is max−min as
a percentage of that median. Twenty-four cells exceed 3%: all sixteen
prefill-at-512 cells, seven of the eight llama.cpp serve cells, and one hipml
serve cell, the gated file. The matrix marks those columns †. The worst are
llama.cpp's prefill at 512 tokens, which ranges from 6.16% to 26.37% across
files because its first request of each process is cold.
llama.cpp is two builds on this card, and the baseline is the faster one.
Both builds take the flags the matrix uses — -ctk q8_0 -ctv q8_0 -ngl 99 -c … --parallel 8 — and both see the same 31.9 GiB card. They are not the same
engine. Vulkan is 2.07% to 5.05% faster on decode at both depths and
13.69% to 33.48% slower on prefill, so the faster backend is not the same
one on every axis, and "llama.cpp" without a backend is an ambiguous baseline.
The decode and serve columns below therefore use the faster backend per cell,
and the cell carries the mark: r for the ROCm build, v for the Vulkan build.
Prefill stays on ROCm, where the ROCm build is the faster one, and the session's
prefill numbers are unchanged. The check was one hold, one process per cell, the
same fixture ids, q8 KV on both engines, -ngl 99, one warm-up request
discarded, then three timed reps. The warm-up is not decoration: the previous
slice measured a 257 ms cold first request on this box, which is what made the
session's prefill-at-512 spreads as wide as 26%. The Vulkan build was pinned to
the R9700 with -dev Vulkan1, because it enumerates the integrated GPU first
and the default would have measured the wrong device.
hipml was re-measured in the same hold on three of the eight files as a control. Its decode agreed with the table to 0.04%–0.86% and its serve to 0.17%–0.99%, so the engine column stands and only the baseline moved.
VRAM measured from outside both engines. Peak memory is WDDM dedicated usage for the whole process, sampled by the same external PowerShell script for both engines. That choice is the difference between a comparison and two self-reports: each engine accounts for its own allocations in its own way, so a number printed by the engine measures that engine's bookkeeping, not the memory the card gave it. An external sample is the same quantity for both. The two samples per CLI cell agree to within 0.01 MiB, so the memory axis has no measurement noise at all.
The session also has a reproducibility check built in. The same file, harness and llama.cpp binary were measured 4.7 hours earlier on a different tree. Every one of the six cells moved by less than 1.4%: prefill at 512 by −1.37%, prefill at 8,192 by −0.06%, decode at depth 0 by −0.16%, decode at 8,192 by +0.08%, serve by +0.02%, peak VRAM by 0.00%. The engine changed; the measurement did not.
The matrix
Δ is (hipml − llama.cpp) on the medians, so a negative number means the engine
is below. Each cell is hipml / llama.cpp · Δ, and the llama.cpp number is the
faster of its two backends on that cell, marked r (ROCm) or v (Vulkan). File
names are shortened; every row is the .gguf named in the attempt table. †
marks a column that contains a cell whose spread exceeds 3% of its median.
| file | prefill @512 † | prefill @8,192 | decode @0 | decode @8,192 | serve b † | peak VRAM |
|---|---|---|---|---|---|---|
Arete-27B-Q4_K_M | 1,417.50 / 1,066.24 r · +32.94% | 1,367.85 / 1,185.93 r · +15.34% | 31.26 / 31.49 v · −0.75% | 30.20 / 30.91 v · −2.27% | 133.98 / 126.05 v · +6.29% | 25,003 / 22,490 · +11.18% |
OrcaCyber-…-Mix-15.7G | 1,326.45 / 1,231.50 r · +7.71% | 1,325.76 / 1,376.98 r · −3.72% | 33.80 / 34.30 v · −1.45% | 32.60 / 33.45 v · −2.56% | 127.93 / 120.07 r · +6.55% | 23,504 / 20,705 · +13.52% |
Qwen3.8-27B-Q4_K_M | 1,362.67 / 1,038.76 r · +31.18% | 1,351.40 / 1,160.14 r · +16.49% | 32.41 / 32.75 v · −1.02% | 31.29 / 32.07 v · −2.43% | 129.00 / 123.19 v · +4.71% | 24,571 / 21,736 · +13.05% |
Qwen3.8-27B-UD-Q4_K_M | 1,335.29 / 1,203.89 r · +10.91% | 1,327.13 / 1,351.43 r · −1.80% | 33.16 / 32.92 v · +0.74% | 32.02 / 32.25 v · −0.70% | 131.99 / 114.56 r · +15.21% | 24,288 / 21,429 · +13.34% |
Qwen3.8-27B-UD-Q4_K_XL | 1,334.29 / 1,133.48 r · +17.72% | 1,319.83 / 1,272.25 r · +3.74% | 31.54 / 31.62 v · −0.25% | 30.51 / 30.81 v · −0.95% | 131.56 / 110.89 v · +18.64% | 25,263 / 22,367 · +12.94% |
Qwen3.8-27B-UD-Q6_K | 1,304.31 / 823.80 r · +58.33% | 1,292.58 / 904.63 r · +42.88% | 26.07 / 26.08 v · −0.03% | 25.33 / 25.61 v · −1.11% | 119.95 / 101.65 v · +18.01% | 29,500 / 26,279 · +12.26% |
Qwen3.8-27B-UD-Q6_K_XL | 1,318.80 / 884.78 r · +49.05% | 1,320.77 / 990.30 r · +33.37% | 23.01 / 22.92 v · +0.39% | 22.45 / 22.56 v · −0.49% | 68.90 / 96.86 v · −28.87% | 32,436 / 29,462 · +10.09% |
Swift-1.5-Qwen3.8-27B-Q4_K_M | 1,399.81 / 1,054.35 r · +32.77% | 1,361.03 / 1,183.00 r · +15.05% | 31.16 / 31.60 v · −1.39% | 30.13 / 31.04 v · −2.95% | 132.43 / 125.97 v · +5.13% | 25,226 / 22,477 · +12.23% |
Read by column, the six axes say six different things.
Prefill at 512 is the widest win and the least clean measurement. The engine
wins on 8 of 8, from +7.71% to +58.33%. Every one of those cells is marked †
on both sides: the engine's own spreads are 3.16% to 4.12%, and llama.cpp's are
6.16% to 26.37% because its first request in each process pays a cold-start
cost. The medians separate anyway, by 95 to 481 tokens per second, but the
honest reading is that the engine's prefill is stable and llama.cpp's is not.
Prefill at 8,192 is where the range collapses. The engine wins 6 of 8, from +3.74% to +42.88%, and loses 2. Both losses are below, with their margins. The larger point is what the column does not show: across the seven 27B files the engine spans 1,292.58 to 1,367.85 tok/s at this depth — 5.7% of its own median — while llama.cpp spans 904.63 to 1,351.43, 37.8% of its median. The engine's prefill does not care which quant the file is. llama.cpp's does, and the biggest wins in the column (+58.33% and +42.88%) are not the engine getting faster; they are llama.cpp falling to 823.80 and 904.63 on the two Q6 files.
Decode at depth 0 is not a win once the baseline is the faster backend.
Against the ROCm build it was 8 of 8, +0.63% to +3.02%. Against the Vulkan
build it is 2 of 8: UD-Q4_K_M at +0.74% (33.16 against 32.92 tok/s) and
UD-Q6_K_XL at +0.39% (23.01 against 22.92), with UD-Q6_K level at −0.03%.
The other five are below, from −0.25% to −1.45%, which is −0.08 to −0.50 tokens
per second. The whole column spans 0.74 tok/s, so this is a near-tie either
way. What it is not is a win, and the previous version of this table said it was
because it compared against the slower backend.
Decode at 8,192 is below on 8 of 8. −0.49% to −2.95%, or −0.11 to −0.92 tokens per second, on cell spreads of 0.06% to 0.65%. The Vulkan build is 2.11% to 5.05% faster than the ROCm build at this depth on every file, and that gap is larger than every cell's spread, so the sign is not in doubt. The engine loses 2.4% to 3.6% of its own decode between the two depths; the Vulkan build loses 1.6% to 2.6%, so the gap widens with context rather than closing.
Eight-slot serve is still a win, and a much narrower one. 7 of 8, +4.71% to
+18.64% on aggregate goodput, which is 5.81 to 20.67 tokens per second across
eight streams. The eighth is the gated file at −28.87%, and it is below. The
Vulkan build is the faster serve backend on six of the eight files — by 2.88% on
UD-Q6_K_XL, 7.33% on UD-Q6_K, 11.71% on UD-Q4_K_XL, 25.61% on
Qwen3.8-27B-Q4_K_M, 27.64% on Arete and 39.91% on Swift — and the ROCm
build is faster on two, OrcaCyber by 28.74% and UD-Q4_K_M by 7.92%. Those
two rows keep the ROCm number. The previous version of this column quoted
+6.55% to +38.84%; the top of that range was Arete against the ROCm build, and
against Vulkan the same cell is +6.29%.
The same cell records median time to first token, for the same server the
throughput baseline uses: lower on 6 of 8, by 0.82% to 38.22%, and higher on two
— +21.55% on Qwen3.8-27B-Q4_K_M and +18.61% on the gated file. Against the
ROCm build it was lower on 7 of 8. The Vulkan build's prefill is the slow part
of that server, and the latency no longer tracks the throughput on every row.
Peak VRAM is lost on 8 of 8. +10.09% to +13.52%, which is 2,514 to 3,221 MiB on the files where both engines ran. There is no cell in the session where the engine peaks lower, and the axis has no measurement noise to explain it away.
Quality: a tie, and a quant ladder that is nearly flat
Perplexity is one number on one 28 KB corpus, so it is a narrow quality check rather than a benchmark suite. It is also a deterministic sum, which makes it a clean comparison: repeated runs of the same file and variant returned the same value to four decimals, and the largest spread over any file and variant was 0.0000.
| file | GiB | hipml ppl | llama ppl (-fa off, f32 KV) | Δ | llama ppl (default) | Δ |
|---|---|---|---|---|---|---|
Arete-27B-Q4_K_M | 16.02 | 2.0384 | 2.0410 | −0.13% | 2.0399 | −0.07% |
OrcaCyber-…-Mix-15.7G | 14.62 | 2.0497 | 2.0505 | −0.04% | 2.0490 | +0.03% |
Qwen3.8-27B-Q4_K_M | 15.66 | 2.0353 | 2.0368 | −0.07% | 2.0377 | −0.12% |
Qwen3.8-27B-UD-Q4_K_M | 15.43 | 2.0291 | 2.0266 | +0.12% | 2.0295 | −0.02% |
Qwen3.8-27B-UD-Q4_K_XL | 16.35 | 2.0353 | 2.0363 | −0.05% | 2.0399 | −0.23% |
Qwen3.8-27B-UD-Q6_K | 20.47 | 2.0238 | 2.0277 | −0.19% | 2.0247 | −0.04% |
Qwen3.8-27B-UD-Q6_K_XL | 23.56 | 2.0235 | 2.0242 | −0.03% | 2.0268 | −0.16% |
Swift-1.5-Qwen3.8-27B-Q4_K_M | 16.24 | 2.0495 | 2.0507 | −0.06% | 2.0508 | −0.06% |
The largest disagreement on either llama.cpp configuration is 0.23%, on
UD-Q4_K_XL against llama.cpp's default f16 KV, and the largest on the f32-KV
configuration is 0.19%. On the seven files that pass the gate, the two engines
are not distinguishable on perplexity. The eighth is gated out of the speed
comparison and its perplexity agrees to 0.035%; that row is discussed below.
The useful finding falls out of the same table. The 27B family runs from 15.43 to 23.56 GiB and buys very little quality for the size:
| step | weights | hipml ppl | decode @0 | peak VRAM @8,192 |
|---|---|---|---|---|
Qwen3.8-27B-Q4_K_M | 15.66 GiB | 2.0353 | 32.41 tok/s | 18,677 MiB |
Qwen3.8-27B-UD-Q4_K_M | 15.43 GiB | 2.0291 | 33.16 tok/s | 18,395 MiB |
Qwen3.8-27B-UD-Q4_K_XL | 16.35 GiB | 2.0353 | 31.54 tok/s | 19,369 MiB |
Qwen3.8-27B-UD-Q6_K | 20.47 GiB | 2.0238 | 26.07 tok/s | 23,606 MiB |
Qwen3.8-27B-UD-Q6_K_XL | 23.56 GiB | 2.0235 | 23.01 tok/s | 26,779 MiB |
From the stock Q4_K_M to UD-Q6_K_XL is 0.58% of perplexity — 2.0353 to 2.0235 — for
−29.00% decode throughput and +7.90 GiB of weights, which is +7.91 GiB
of peak VRAM at 8,192 tokens. The ladder is nearly flat in quality and steep in
cost. If the choice is "which quant fits", the answer is at the low end of this
ladder, not the top.
Two steps inside it are worth naming. UD-Q4_K_M is smaller than the stock
Q4_K_M (15.43 against 15.66 GiB), better on perplexity (2.0291 against
2.0353, −0.30%) and 2.32% faster in decode. And UD-Q4_K_XL is a dead
step: its perplexity is 2.0353, the same as the stock file to four decimals,
while it costs 0.69 GiB more than the stock file and gives up 2.69% of decode
against it. It is also 0.92 GiB larger than UD-Q4_K_M and 0.31% worse on
perplexity. Paying 0.92 GiB for a worse score is the kind of trade a table makes
visible and a model card does not.
The losses
Prefill at 8,192: two cells, both real. OrcaCyber-…-Mix-15.7G is −3.72%,
1,325.76 against 1,376.98 tok/s, on spreads of 0.73% and 0.44% — separated, and
the cell passes the 12-id gate, so it is a comparison rather than a gated row.
Qwen3.8-27B-UD-Q4_K_M is −1.80%, 1,327.13 against 1,351.43, on spreads of
0.73% and 0.70% — also separated, also gated in. Neither is noise, and neither
is explained away by saying the engine had a bad cell: 1,325.76 and 1,327.13 are
inside the engine's own 5.7% band at this depth. These are the two files with
llama.cpp's two highest prefill-at-8,192 numbers in the session. The engine did
not get slower; llama.cpp got faster.
Decode: eight of eight below at 8,192, and six of eight at depth 0. The
largest is Swift-1.5 at 8,192, −2.95%, 30.13 against 31.04 tok/s, on spreads
of 0.41% and 0.15% — separated. The smallest is UD-Q6_K_XL at 8,192, −0.49%,
22.45 against 22.56, on spreads of 0.57% and 0.24% — also separated, and small
in absolute terms. At depth 0 the two wins are UD-Q4_K_M at +0.74% (33.16
against 32.92) and UD-Q6_K_XL at +0.39% (23.01 against 22.92), and UD-Q6_K
is level at −0.03%. Neither win is larger than 0.24 tokens per second. The
column is a tie in magnitude and a loss in sign, and the reason the first
version read it the other way is the backend, not the engine.
Serve b: one cell below by a wide margin, and gated out. On
UD-Q6_K_XL the engine does 68.90 tok/s against llama.cpp's Vulkan build at
96.86, −28.87%, with the engine's own six waves spanning 62.12 to 69.00 (9.99%)
and the Vulkan server's three spanning 90.5 to 96.9 (6.56%). The cell sits at
32,436 MiB, the largest peak anywhere in the session. The cause is
unexplained: all 65 server and gate logs were scanned for seven markers —
failed to allocate, out of memory, to cpu, cpu buffer, hipMalloc,
hip_out_of_memory and page fault — and none
matched. It
is not called paging, because the logs do not say paging; it is called
unexplained, and the row is gated out of the comparison because the file
diverges at id 4. That does not make the number go away, and it is in the table
for that reason.
Peak VRAM: eight of eight, with no exception.
| file | cli @0 h / l | cli @8,192 h / l | serve b h / l | serve Δ |
|---|---|---|---|---|
Arete-27B-Q4_K_M | 17,682 / 16,606 | 19,046 / 16,870 | 25,003 / 22,490 | +11.18% |
OrcaCyber-…-Mix-15.7G | 16,183 / 14,822 | 17,610 / 15,085 | 23,504 / 20,705 | +13.52% |
Qwen3.8-27B-Q4_K_M | 17,314 / 15,865 | 18,677 / 16,128 | 24,571 / 21,736 | +13.05% |
Qwen3.8-27B-UD-Q4_K_M | 17,031 / 15,546 | 18,395 / 15,809 | 24,288 / 21,429 | +13.34% |
Qwen3.8-27B-UD-Q4_K_XL | 17,941 / 16,497 | 19,369 / 16,760 | 25,263 / 22,367 | +12.94% |
Qwen3.8-27B-UD-Q6_K | 22,179 / 20,408 | 23,606 / 20,671 | 29,500 / 26,279 | +12.26% |
Qwen3.8-27B-UD-Q6_K_XL | 25,352 / 23,579 | 26,779 / 23,843 | 32,436 / 29,462 | +10.09% |
Swift-1.5-Qwen3.8-27B-Q4_K_M | 17,905 / 16,606 | 19,332 / 16,870 | 25,226 / 22,477 | +12.23% |
The gap is present at depth 0 before any long context, grows with context, and
grows again with eight slots: on UD-Q4_K_M it is 1,485 MiB at depth 0, 2,586
MiB at 8,192 and 2,859 MiB in serve. Both serve configurations are 16,384
tokens per slot — llama.cpp's -c 131072 is the pool divided across its eight
slots — so the serve cell is like-for-like on context. The engine peaks higher
anyway. This session measured the size of the gap, not its cause; the
decomposition in ../notes/serve-vram.md is the place
to look for that, and it was measured on a different tree.
The gate, and what it does not prove
Before any file is timed, both engines generate 12 greedy ids from the same 169-id prompt and the ids are diffed. A file that does not reproduce is not compared. This is the check that makes the rest of the table a comparison rather than two independent benchmark runs.
Seven of the eight files that run reproduce 12 of 12 ids. The eighth,
Qwen3.8-27B-UD-Q6_K_XL.gguf, diverges at id 4: the engine continues
310 2649 264 47057 … where llama.cpp continues 4087 1156 25 12870 …. Its
perplexity on the fixed corpus agrees with llama-perplexity to 0.035%
(2.0235 against 2.0242). The divergence is a near-tie in the argmax, not a
misread file. It is still gated out, because a model whose ids we do not
reproduce is not a model we quote a speed ratio for.
That is the easy half of the gate's story. The hard half is the control. A
128-token greedy probe on the same prompt was run on the gated file and on
Qwen3.8-27B-UD-Q6_K.gguf, a file that passes the 12-id gate:
| file | ids identical | first difference |
|---|---|---|
Qwen3.8-27B-UD-Q6_K.gguf (passes 12) | 21 of 128 | id 20 |
Qwen3.8-27B-UD-Q6_K_XL.gguf (gated out) | 17 of 128 | id 4 |
The control diverges at id 20. A file that passes the 12-id gate fails a 128-token one, which means 12 ids is a shallow discriminator: it catches a divergence that starts early, and it cannot see one that begins after the twelfth id.
What the gate establishes is narrow and worth stating precisely: at 12 tokens, the two engines agree on the argmax for seven files; a disagreement is detectable; and a file that disagrees is removed from the comparison rather than averaged into it. What it does not establish is that the engines compute the same thing beyond 12 tokens, that agreement implies numerical equivalence, or that either engine is exact against its own reference. The control is the evidence for the last point: a passing file diverges by id 20, so "passes the gate" means "passes 12 ids", not "reproduces". Any reader who takes the gate as a correctness certificate is taking it further than this run supports, and the 128-token probe is here so that is visible rather than implied.
What this does not claim
It does not claim the engine is faster. It wins prefill at 512 on every file, wins serve on seven of eight, is level or behind on decode, ties on quality, and loses memory on all eight. Any summary that leads with the prefill column without the VRAM column is not this table.
It is one engine, one card and one session, plus the backend check that re-measured the llama.cpp baseline. The card is a 31.9 GiB R9700 and every file here fits in 32 GB; nothing in this run says what happens on a smaller card, a different vendor, or a file that needs offload. The context lengths are two: 576 and 8,256 tokens for the CLI cells, 16,384 per slot for serve. There is no claim about 32k, 128k or 262k, which is the context the files declare.
It is eight files from one directory, not a model census. The other eight either cannot load or cannot generate, and the attempt table is the boundary of the claim. It is also not a quality ranking: one 28 KB corpus and one perplexity number per file cannot rank models, only show that the two engines score the same weights the same way.
The serve cell is aggregate goodput at eight slots on one prompt distribution. It is not a claim about sixteen slots, other arrival patterns, or tail latency under load. And the deltas are medians from one session — two, for the decode and serve columns, whose baseline was re-measured — and the reproducibility check against the run 4.7 hours earlier is the reason to trust the engine column, not a second session that would make it stronger.
The next file is a mixture of experts
The interesting failure is the mixture-of-experts file.
Qwen3.6-35B-A3B-MTP-UD-Q4_K_XL.gguf is 753 tensors, 40 decoder blocks plus an
inline MTP block, and 256 experts with 8 used per token. It loads — every tensor
uploads — and generation stops at its embedding table, which is Q8_0 where the
graph takes Q4_K or Q6_K. The MoE forward pass itself is the work in progress,
and that is why the file is not in the matrix.
What it would cost is arithmetic, not measurement. There is no hipml MoE throughput number in this article, because none exists yet. The GPU path is being built now, and everything in this section is a prediction from the file's tensor inventory and the bandwidth the dense model already achieves, not a result.
llama.cpp already runs the file, and it is the bar the engine's MoE path will be measured against. Warm, q8 KV, 33 greedy tokens: 96.35 tok/s decode on its ROCm build and 131.23 on Vulkan at depth 0, 93.40 and 126.39 at 8,192; prefill 3,526 and 3,331 at 512 tokens, 4,259 and 3,825 at 8,192. That is 3.0× to 4.0× the dense model's decode on the same card, in the same direction the arithmetic below predicts. It also re-prices the prediction: the engine's 176 tok/s would be 1.34× llama.cpp's faster backend, not the 5.30× it is against the dense model.
Per token at 4,096 context, the file would stream 2.92 GB (2,921,190,016 bytes), against 15.48 GB for the 27B dense model — a ratio of 5.30. At the bandwidth the dense model already achieves in this session, its 33.16 tok/s becomes about 176 tok/s.
The reason is the gather. The expert FFN is 88.09% of the file but only 21.01% of a token, because a token reads 8 of 256 experts. Everything else — the gated-delta-net projections, the full-attention layers, the router, the shared expert, the LM head — is where the other four fifths go. The knife edge is that reading every expert instead of gathering 8 would stream 21.94 GB per token, which at the same bandwidth is 23.4 tok/s: slower than the 27B dense model. The gather is not an optimisation on top of the feature; it is the feature. A MoE path that reads all experts would be a regression, and the arithmetic says so before a line of the kernel is written.
Where the numbers come from
- The single-model session this one extends, and the decode bandwidth it
establishes:
../benchmarks.md. - The model file, its tensor histogram and the load checks:
../native-qwen.md. - The MoE tensor inventory and the 256/8/512 configuration:
../notes/moe.md. - The serve VRAM decomposition, measured on an earlier tree:
../notes/serve-vram.md. - The serve prefill chunk that both engines now match:
../notes/serve-prefill-chunk.md. - The stock-model release run and the dense bytes-per-token figure:
../release-run.md. - The decode roofline this article's bandwidth number sits on:
../notes/decode-roofline.md.